The Demand Curve
The Demand Curve, as shown below, is a visual description of the increasing level of capacity volume (kW) required as the price (£/kW) decreases during each round. The demand curve therefore shapes the Auction by specifying the lowest limit of capacity volume that may be acquired (at the highest price or "price cap"), the target level of capacity, and the upper limit of capacity volume that may be acquired (at the lowest price or "price floor"). As the Auction proceeds with the price descending, the capacity volume required for the Auction to clear increases.
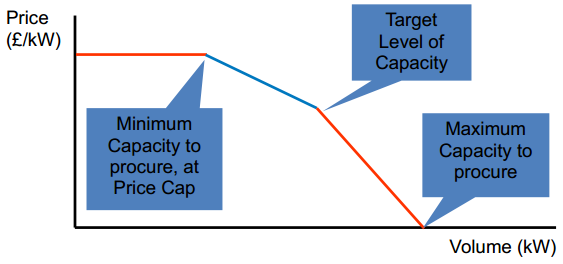
The Demand Curve therefore captures the trade-off between the cost of capacity and Security of Supply according to the Auction Parameters specified in the Auction Guidelines. The demand curve is established by the Secretary of State, and based on National Grid's Electricity Capacity Report.