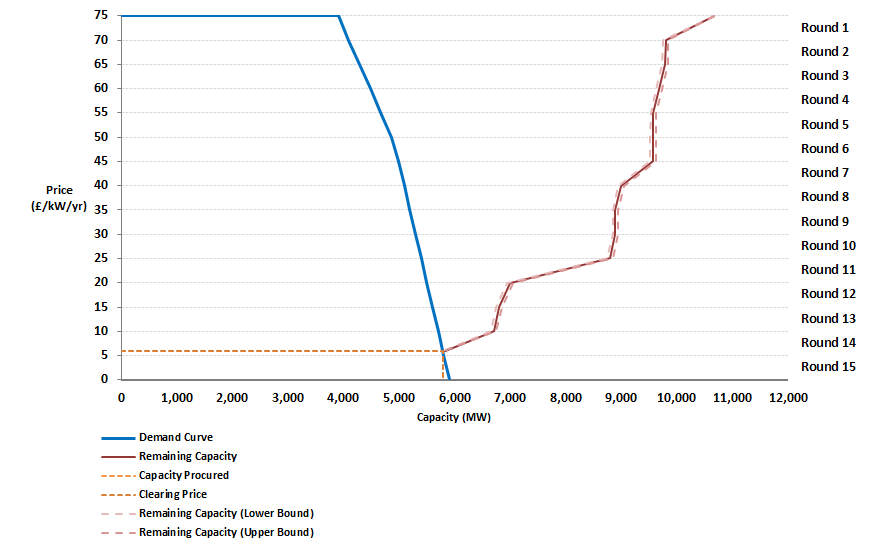
T-1 Auction (Delivery Year: 2018-19) - Published Round Results
Capacity Market Rule 5.5.18 Requires the Auctioneer to Announce and Publish the following information prior to the start of each Bidding Round:
- The Bidding Round Price Spread.
- The Potential Clearing Capacity at the Bidding Round Price Floor for that Bidding Round.
- Except in relation to the first Bidding Round, the Excess Capacity as at the start of the Bidding Round..
The Bidding Round Price Spread will be £5/kW for each Bidding Round, as described in the Auction Guidelines. The "Potential Clearing Capacity" is identical to the demand curve at a given price. The Excess Capacity is the excess of supply over demand at a particular price. The Excess Capacity is rounded to the nearest 100 MW, where the Excess Capacity falls below 100 MW, "Below 100 MW" will be displayed. Once the (unrounded) Excess Capacity falls below zero, the Auction will clear, subject to Capacity Market Rule 5.9.
These values are displayed in the Table below and charted in Figure 1. They will be updated approximately10 minutes prior to the start of each Bidding Round. This coincides with the release of this information to Bidders.
The Graph below shows the Rounded Excess Capacity added to the Potential Clearing Capacity, that is, the Remaining Capacity, or Supply. The supply will only be shown at a Bidding Round Price Cap/Floor, with a linear interpolation within a round. Two curves will be shown, giving upper and lower bounds for the supply, given the rounding to the published Excess Capacity figures.
By Examining the Capacity Market Register, it can be verified that the Capacity Entering the Auction is 10663.717 MW De-Rated Capacity. This Capacity is the Supply at the Auction Price Cap in Figure 1 below.
The Auction has cleared in Round 14. The Clearing Price is £6.00 /kW/year.
The full Provisional Results Report is available here.
The Provisional Results Report Appendix A is available in .xlsx format.
The Auction Results will remain Provisional until 13th February 2018 (Auction Results Day).
The Final Results Report is available here.
The Final Results Report Appendix A is available in .xlsx format here.

Figure 1: Rounded Remaining Capacity
| Round Number | Bidding Round Price Spread(£/kW/y) | Potential Clearing Capacity at the Bidding Round Price Floor (MW) | Excess Capacity as at the start of the Bidding Round (MW) |
| Round 1 | 75 - 70 | 4092.308 | - |
| Round 2 | 70 - 65 | 4284.615 | 5700 |
| Round 3 | 65 - 60 | 4476.923 | 5500 |
| Round 4 | 60 - 55 | 4669.231 | 5200 |
| Round 5 | 55 - 50 | 4861.538 | 4900 |
| Round 6 | 50 - 45 | 4981.633 | 4700 |
| Round 7 | 45 - 40 | 5083.673 | 4600 |
| Round 8 | 40 - 35 | 5185.714 | 3900 |
| Round 9 | 35 - 30 | 5287.755 | 3700 |
| Round 10 | 30 - 25 | 5389.796 | 3600 |
| Round 11 | 25 - 20 | 5491.837 | 3400 |
| Round 12 | 20 - 15 | 5593.878 | 1500 |
| Round 13 | 15 - 10 | 5695.918 | 1200 |

